Executable image creation:
Programs are nothing but executable files containing instructions that will be exected on the CPU. The actual creation of an executable image is a multi-step process. Several development kits exists to create the image, Microsoft has also provided tools in the SDK/WDK and an integrated development environment called Visual Studio to guide you through this process. The overall work flow looks like this:
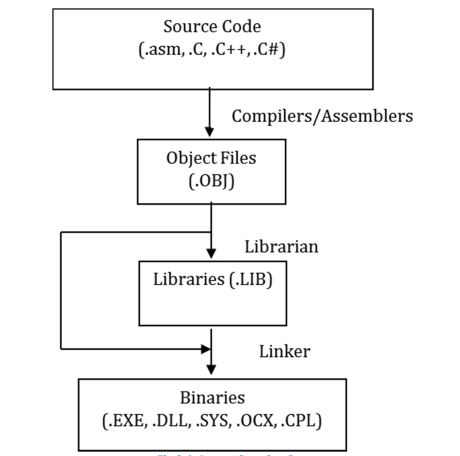
Lets look at a few commonly used terms:
Assemblers convert assembly language to machine code in the form of object files. These are machine dependent and generally not portable code. Assemblers operate on one source module at a time.
Compilers convert code written in high level languages to machine code in the form of object files. Compilers operate on one source module at a time. C, C++, C# are some examples of high level languages for which Microsoft has released compilers. You can download Visual Studio Community edition and it choose the options you need, there are lots of walkthroughs for this online.
Librarian in contrast to assembler or compiler just assists in bundling various object files into a single library file.
Linker generates the final binary by combining all the object files, resolving all the dependencies. Linker is the tool capable of generating symbol files to assist in debugging.
Debugging is a methodical process of identifying a problem in a piece of software or hardware.
Debugger is a program that allows observation of another program either in an invasive or a noninvasive fashion. Two typical features that debuggers offer would be: * Ability to set up breakpoints * Ability to step or trace through code
Debuggers are classified into:
- low-level debugger – the one that assist in debugging but with the help of disassembly
- symbolic debugger – assists debugging with help of symbols like variable, functions names
- source-level debugger – assists debugging with relevant source code
Debuggers are also classified into:
- User mode debuggers - ones that can attach to any user mode process. Ex: Ollydbg, Immunity debugger, windbg
- Kernel mode debuggers - one that can attach to the kernel of a running machine. Ex: kdb, and windbg
Now that we know these terms, let’s get a debugger installed. I dunno about you, but my career didn’t start out with programming. I did my engineering in Electronics and had some background with Microprocessors and micro controller programming. In my current role as an EE, we deal with analysing process, kernel and complete dumps all the time. The first debugger introduced to me was windbg, and so even before I started writing production quality code, I had windbg on my machine. Windbg is my tool of choice mainly because it is both a user mode and a kernel mode debugger, and because it has a framework that lets me develop extensions and download necessary symbols.
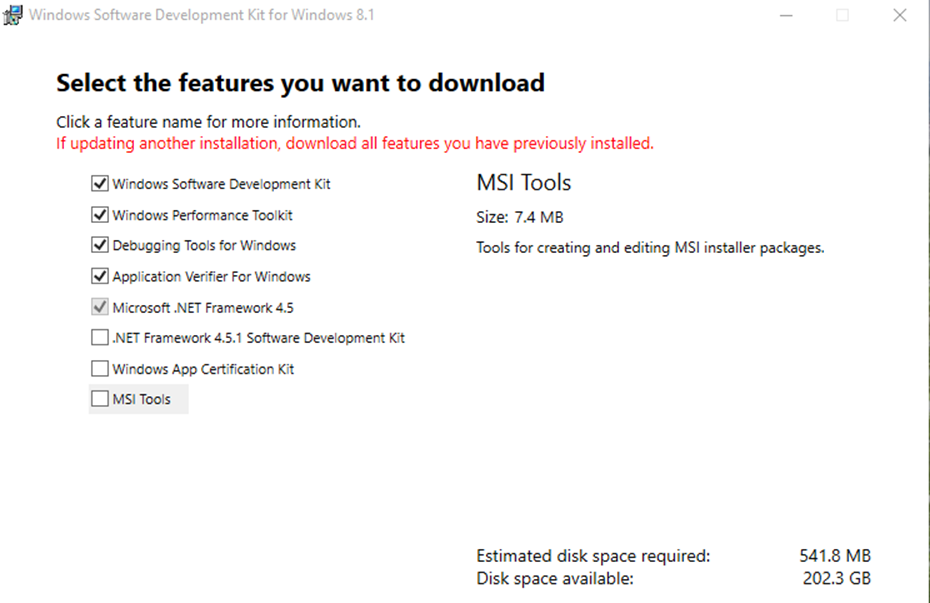
If you’re a Windows guy like me, then you can get the Software development kit (which includes a compiler) and the Debugging tools for Windows together as part of the Windows SDK. At the time of writing, the SDK for 8.1 was the latest – you can download it from the below link: https://www.microsoft.com/click/services/Redirect2.ashx?CR_EAC=300135395
It’s better to install the SDK and debugging tools together, so you have a complete package for your learning and don’t have to come back to install it again. The Performance toolkit is a great tool for troubleshooting leaks, and high CPU issues – I highly recommend installing it. Application verifier is optional.
Once you have the debugging tools downloaded, also set up your Symbol Path. It’s a good idea to do this using environment variables so that your other tools such as procmon, wpa and message analyzer can also pick up symbols using the same path.
Configuring the _NT_SYMBOL_PATH environment variable:
- Start > run > sysdm.cpl
- Go to the Advanced Tab > Environment Variables.
- Under user variables, click New.
- Give the variable name as : _NT_SYMBOL_PATH
- Give the variable value as :
srv*C:\PublicSymbols*http://msdl.microsoft.com/downloads/symbolsand then click OK to save.- Make sure that C:\PublicSymbols folder exists on the machine, otherwise create a folder at that path.
About WinDBG:
Windbg can be used to debug user mode applications running on the same or remote machine, as well as to debug the Windows Kernel of a remote machine. The machine where windbg is installed is usually called debugger machine and the machine which is being debugged is called the debuggee machine.
When it comes to user mode debugging, Windbg allows you to either launch a process under the debugger, attach to an existing process open a dump of a process taken earlier, or to open an executable by treating it as a flat file/dump. In this demo, we’ll launch notepad.exe under the debugger to study the PE headers of the file.
Launching a process under windbg:
- To launch a process under the debugger, Go to start > search for windbg.exe and launch it.
- Once windbg is up and running, choose the “Open Executable” option in the File Menu.
- In the File Open Dialog box, point to C:\Windows\notepad.exe and click ok. After a few seconds you will see the below screen.
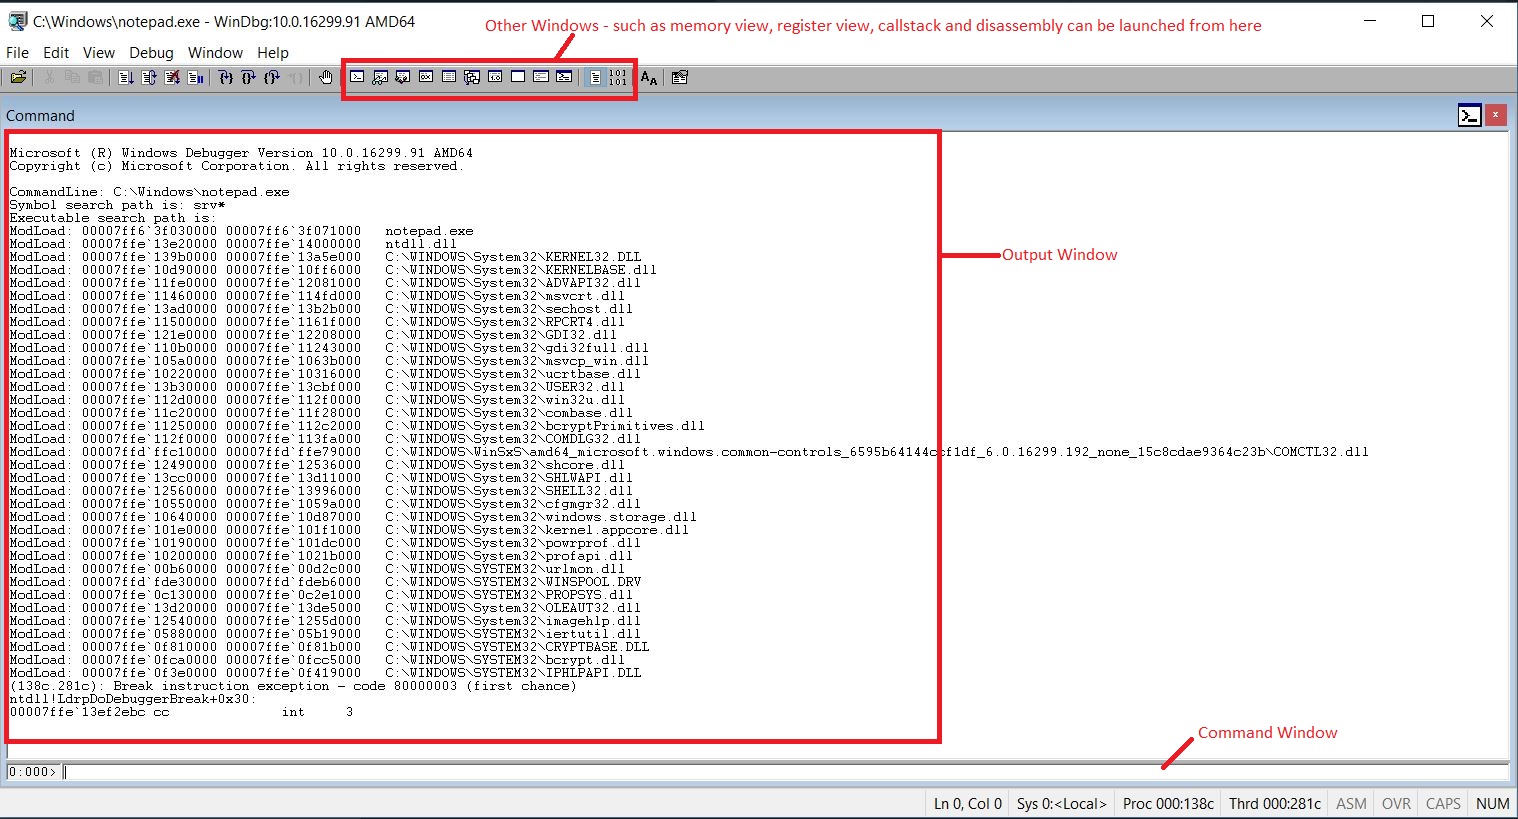
Once a process is launched under the debugger, the debugger loads all the binary and its dependent dlls, initialises the process and then breaks. You will see the list of loaded dlls in the output window, and the command window will now be ready to receive commands. At this point you can start entering commands and control execution.
Assuming you have already set the _NT_SYMBOL_PATH environment variable as mentioned earlier, type lmvm notepad. This should give you an output similar to the one below. Note - I’m running 64 bit version of Windows 10, so my addresses here are all 64 bit. The details displayed are partially from the PE header. What’s important for us is the address given under “start”, this is the start address where the module is loaded.
0:000> lmvm notepad
Browse full module list
start             end                 module name
00007ff6`3f030000 00007ff6`3f071000   notepad    (deferred)
    Image path: notepad.exe
    Image name: notepad.exe
    Browse all global symbols  functions  data
    Timestamp:        A0C4CEAB
    CheckSum:         0004AC7B
    ImageSize:        00041000
    File version:     10.0.16299.15
    Product version:  10.0.16299.15
    File flags:       0 (Mask 3F)
    File OS:          40004 NT Win32
    File type:        1.0 App
    File date:        00000000.00000000
    Translations:     0409.04b0
    CompanyName:      Microsoft Corporation
    ProductName:      Microsoft® Windows® Operating System
    InternalName:     Notepad
    OriginalFilename: NOTEPAD.EXE
    ProductVersion:   10.0.16299.15
    FileVersion:      10.0.16299.15 (WinBuild.160101.0800)
    FileDescription:  Notepad
    LegalCopyright:   © Microsoft Corporation. All rights reserved.
The PE format:
For a binary to run in an operating environment, it is essential that the binary adhere to the standard that operating system defines. The Portable Executable (PE) file format is used by Windows executables, object code, and DLLs. This format has been derived from the COFF (Common Object File Format) image format - Refer to “Microsoft PE and COFF Specification” on MSDN for complete specification: https://msdn.microsoft.com/en-us/windows/hardware/gg463119.aspx
In practice - the PE file format is a data structure that contains the information necessary for the Windows OS loader to load and manage the executable. PE files begin with a header that includes information about the code, the type of application, required library functions, and space requirements, and in my opinion - this should be your starting point for analyzing the malware.
Now that you have a debugger installed - you are ready to load dumps, launch executables and attach to processes etc. In the next post, we’ll walk through the PE image format.